Friday, 5 June 2020

AI Holistic Adoption for Manufacturing and Operations: Value

By Dawn Fitzgerald, the AI Trends Insider on Executive Leadership

[Editor’s Note: Today we are introducing a four-part series on AI Holistic Adoption for Manufacturing and Operations, written by Dawn Fitzgerald from an executive leadership perspective. The columns are to include key execution topics required for the enterprise digital transformation journey. Planned topics include: Value, Program, Data and Ethics.]

Dawn Fitzgerald, Head of Innovation, Platforms and Analytics for Schneider Electric

The Executive Leadership Perspective

Successful Digital Transformation and AI adoption requires executive leaders to ensure that AI solutions are bringing Value to the enterprise. Here, Value means that these solutions must be monetizable, sustainable and scalable. Monetizable means able to be turned into cash in the business world; in this context it means to become a source of profit.

For the AI solutions to be monetizable, we must provide measurable value in the near term. Monetization can be in the form of workflow improvements and efficiencies which translate into cost savings, or customer feature enhancements which translate into sales.

Once AI solutions are launched, we protect our investment by ensuring that they are sustainable for industrialized applications, and scalable for future growth opportunities either within our organization or within the product line. Broader strategic industry positioning goals are necessary motivators but not sufficient for successful enterprise AI adoption.

Real Value achieved with Value Analytics approach

The allure of AI and Machine Learning is strong because of its promise of increased capabilities, efficiency and speed. We must however be aware of the temptation to launch AI solutions based on trends without real value add, maybe based on hype. As executives, we are especially susceptible to this risk if our organizations have defined an enterprise strategy to “take an AI leadership position” in our industry. Under these scenarios, data science teams are frequently asked, “What can you do?”, “What do you have for this industry segment?”.

While these are important questions and the input from these skilled teams is highly valuable, it is truly a bottoms-up approach. It must be coupled with a top-down perspective from your strategic marketing teams and industry segment Subject Matter Experts. These experts must bring the focus on where the customer pain points reside and frame these requirements, identifying gaps that could potentially be addressed by AI solutions. The cross functional team then identifies high value targets for potential AI solutions.

It is critical to the success of enterprise AI adoption that the executive leadership take a Value Analytics approach to AI adoption. This means that AI solutions must include identifying user pain points, user stories, a broad analytics algorithmic inclusion, quality criteria and identify success criteria with key analytic value metrics.

A Broad Analytics approach brings Higher Value

To derive higher value and adoption from your AI solutions, it is important to embrace a broader analytics view. This view includes a broader set of analytics (AI/ML algorithms, statistics, observation and reporting) and combinations of ML algorithms to provide measurable value to the end user/customer.

The unique problems of manufacturing and operations environments frequently require the combination of analytics components to optimize the AI solution. These issues include high site to site variation, high human interaction influence, hostile environment and small data problem considerations. As highlighted in the MIT Machine Intelligence for Manufacturing and Operations presentation by MIT’s Prof Duane Boning, research accentuates the need to apply the correct Machine Learning methods or combination of methods to targeted Manufacturing and Operations Use Cases.

Metrics of Value Analytics

Results Measurement is a critical tool for executive leaders to manage their businesses. Focused Results Measurement is mandatory for executive leaders that are driving digital transformation and AI solutions in their organizations. The Value Analytics approach demands a definition of the pain point to be resolved along with user stories and a clear measurement of success.

Clear Success Criteria must be defined before the AI solution efforts begin. This ensures monetization results vs exploratory research. Executive leaders need to frame these requirements for the marketing and development teams executing the AI solutions.

Plant and Grow the Seed

To achieve the goals of enterprise Digital Transformation and AI adoption, it is critical to start small. The key to success is to identify pointed, isolated, and high value targets for the AI solution. For example, predictability of machine ‘X’ failures or optimization of key manufacturing line parameter ‘Y’. Then, while designing the associated Analytics Program for these targets, the design must also keep the long term, larger scale goals of the Program in mind. The executive leadership must guide their team to design and launch a small Analytics Program with the capability to scale. Goals of larger scale adoption that come into play include expanding the scope of high value targets and expanding the number of teams in the enterprise that address high value targets with AI. Thinking big requires an Analytics Program design that spans all components of AI Holistic Adoption.

Components of AI Holistic Adoption

Defining the Value of AI solutions and realizing the Value of these solutions are two very different things. A recent IDC report on a survey of global organizations that are already using AI solutions found only 25% have developed an enterprise-wide AI strategy. Most organizations want to adopt AI; however, it is much more complex than simply applying a ML algorithm to a data set.

Successful AI adoption is the combination of people, process and tools. This is Holistic Adoption. The people included are not only the designers, but the entire stakeholder base associated with the AI/ML solution in question. Business processes will need adjustment and tools for stakeholders will need to be part of the evolution of the digital culture. All of these components of AI Holistic Adoption must be addressed in the Analytics Program.

Dawn Fitzgerald is Head of Innovation, Platforms and Analytics for Schneider Electric, where she is focused on the development of new digital services. She is experienced with how to make a range of AI technologies work for multi-site, global organizations. Learn more at LinkedIn.

Arduous Hurdles To Overcome In Scaling Up Of AI Autonomous Cars

By Lance Eliot, the AI Trends Insider

Scaling up is abuzz.

What does it mean to seek or reach scale?

Generally, for start-ups, the notion is that you sometimes start relatively small, perhaps making a prototype or a minimally viable product (MVP), and show it off to gain attention and funding. Potential investors and actual investors are usually of the belief that the one-time version of your product can become a mass-produced one.

This is not always the case or might be exorbitantly costly to achieve.

Something that you might have hand-crafted could be terribly difficult and expensive to recreate and produce on any sizable volume.

Furthermore, your product might work for a handful of situations that you tested, but once it is put into wider use, you could unexpectedly discover that it has limitations or flaws of a fatal kind or that constrain your market potential for the product.

Here’s then the question for the day: Will AI-based self-driving driverless autonomous cars be able to scale?

Many outside the driverless car industry are assuming that if you can make one self-driving car, you can make zillions of them.

This assumption is not necessarily the case.

It is important to clarify what I mean when referring to true self-driving cars.

To be a true self-driving car, the AI needs to drive the car entirely on its own without any human assistance during the driving task.

These driverless cars are considered a Level 4 and Level 5, while a car that requires a human driver to co-share the driving effort is usually considered at a Level 2 or Level 3. The cars that co-share the driving task are described as being semi-autonomous, and typically contain a variety of automated add-ons that are referred to as ADAS (Advanced Driver-Assistance Systems).

There is not yet a true self-driving car at Level 5, which we don’t yet even know if this will be possible to achieve, and nor how long it will take to get there.

Meanwhile, the Level 4 efforts are gradually trying to get some traction by undergoing very narrow and selective public roadway trials, though there is controversy over whether this testing should be allowed per se (we are all life-or-death guinea pigs in an experiment taking place on our highways and byways, some point out).

Since the semi-autonomous cars require a human driver, such cars aren’t particularly important to the scaling question. There is essentially no difference between using a Level 2 or Level 3 versus a conventional car when it comes to a matter of scale.

It is notable to point out that in spite of those dopes that keep posting videos of themselves falling asleep at the wheel of a Level 2 or Level 3 car, do not be misled into believing that you can take away your attention from the driving task while driving a semi-autonomous car.

You are the responsible party for the driving actions of the car, regardless of how much automation might be tossed into a Level 2 or Level 3.

For my framework about AI self-driving cars, see this link: https://aitrends.com/ai-insider/framework-ai-self-driving-driverless-cars-big-picture/

For why achieving AI autonomous cars is considered a moonshot, see my explanation here: https://aitrends.com/ai-insider/self-driving-car-mother-ai-projects-moonshot/

To see details about the levels of autonomous cars, refer to my posting here: https://aitrends.com/ai-insider/reframing-ai-levels-for-self-driving-cars-bifurcation-of-autonomy/

On the dangers of AI self-driving cars being a noble cause that gets out-of-hand, see my explanation here: https://www.aitrends.com/selfdrivingcars/noble-cause-corruption-and-ai-the-case-of-ai-self-driving-cars/

Barriers To Scaling Up

True self-driving cars are chock full of specialized sensors, including cameras, radar, LIDAR, ultrasonic units, and various other advanced electronics.

Currently, the driverless cars that are being tried out on our roadways are few and far between, especially when you consider that the number of conventional cars in the United States alone is about 250 million.

The number of (somewhat) self-driving cars is a tiny drop in the bucket of the total car population.

Pundits that believe in a magical future are prone to suggesting that someday soon we’ll have all self-driving cars and no remaining conventional cars. The hope is that by getting rid of all conventional cars, including Level 2 and Level 3 semi-autonomous cars, there won’t be any pesky and car crashing human drivers anymore.

Well, let’s be serious and agree that there’s no economically sound way that we would all overnight discard our conventional cars and instead adopt true self-driving cars.

By magic wand, even if we all did agree to stop using our conventional cars, consider the length of time it would take to ramp-up and produce enough self-driving cars to handle the needed volume of driving in the U.S. alone (approximately 3.12 trillion miles per year).

The scaling aspect is a serious one and not just because of the automobile manufacturing efforts.

Many of the specialized sensors that are being used in today’s experimental self-driving cars are not being sold in the millions upon millions of numbers of units. Thus, those sensor makers would need to scale-up to produce enough of their sensors to fit onto the millions upon millions of self-driving cars that we’ll presumably be seeing built and fielded.

As an aside, the upside potential of riding the self-driving car gravy train is part of the reason that many of the sensor makers are fighting fiercely to get into the experiments taking place today for self-driving cars. Their hope is that by becoming the default sensor for a particular driverless car, their product will surf the massive wave ahead as millions upon millions of self-driving cars are ultimately made and sold.

One important aspect to keep in mind is that the existing experimental tryouts of self-driving cars are being undertaken in a very controlled and small-sized manner.

Once self-driving cars are available in the wild, presumably, the driverless cars will be used as much as possible, running maybe 24 x 7 if possible. This makes sense to get your money’s worth out of the self-driving car. Plus, if demand is going to shoot through the roof for ridership, the odds are that the driverless cars will be in-motion much or most of the time.

Can the sensors being used today on driverless car tryouts handle the rigors of the real world on an ongoing and extensive basis?

We don’t really know if the sensors can handle reality and the hardships of being used all the time.

Pretty much most of the existing driverless car tryouts are being overseen by topnotch maintenance crews. These master crews make sure that the moment a sensor even burps, it gets replaced. Also, when the driverless car comes into the special facility for an evening’s rest, the sensors and other parts of the self-driving car are reviewed to make sure all is in tiptop shape.

It is doubtful that any massive rollout of self-driving cars could entertain the same kind of hand holding.

On a scaling factor, we don’t know if the sensors can scale-up to high usage and the real-world environment of harsh weather, people that bang their shopping carts into your parked driverless car, and the other daily abuses that our everyday cars deal with.

For more about sensors and sensor fusion, see my explanation here: https://www.aitrends.com/ai-insider/multi-sensor-data-fusion-msdf-and-ai-the-case-of-ai-self-driving-cars/

On the topic AI autonomous cars running 24×7, see my indication here: https://aitrends.com/ai-insider/non-stop-ai-self-driving-cars-truths-and-consequences/

For my assessment of the potential extinction of human driving, use this link: https://www.aitrends.com/ai-insider/human-driving-extinction-debate-the-case-of-ai-self-driving-cars/

Consider the importance of Linear Non-Threshold (LNT) in these matters, see my use here: https://www.aitrends.com/ai-insider/linear-no-threshold-lnt-and-the-lives-saved-lost-debate-of-ai-self-driving-cars/

Crucial Scaling Factors

Another scaling factor involves people.

There are some automakers that insist that their self-driving cars will only need to ask a human rider their desired destination, and otherwise, no further interaction is needed.

That’s nonsensical.

Humans riding in today’s Uber and Lyft cars that are driven by a human driver are known for asking and directing the drivers in zillions of varying ways. The need for an actual conversation is important in many ridesharing circumstances.

Can the limited Natural Language Processing (NLP) that an Alexa or Siri provides today be scaled to handle the fluent driving-related conversations that human riders will demand?

Researchers are toiling away at this, but the fluent AI-driver does not yet exist.

Also, what happens when a passenger suddenly starts choking on that leftover T-bone steak that they brought into the self-driving car as a late-night snack?

By removing a human driver from the driverless car, you are also removing the human actions that a driver might render beyond the sole act of driving a car.

Will the notion of not having a human driver be able to scale in the sense that passengers will no longer have a fellow human in the car with them?

For my prediction about new jobs for the use of AI autonomous cars, see this link: https://aitrends.com/ai-insider/future-jobs-and-ai-self-driving-cars/

Here’s my views on what will happen when people sleep in their self-driving cars: https://www.aitrends.com/ai-insider/sleeping-inside-an-ai-autonomous-self-driving-car/

Some people might become addicted to using self-driving cars, see my explanation here: https://aitrends.com/ai-insider/addicted-to-ai-self-driving-cars/

For my explanation about dealing with passenger panic attacks, see this link: https://www.aitrends.com/ai-insider/when-humans-panic-while-inside-an-ai-autonomous-car/

Most of the current tryouts of driverless cars are taking place in confined geographical areas, such as in a restricted area of Phoenix, Las Vegas, San Francisco, and the like.

Will an AI self-driving car readily scale-up to be a good driver in other places?

Some believe that driverless cars can only work properly if the chosen geographic area has been exhaustively mapped and remapped. If that’s the case, the effort and cost to do that mapping might preclude being able to easily have the self-driving car drive in other parts of the country.

Via the use of Machine Learning and Deep Learning, the AI is supposed to get better and better at driving.

Of course, if the self-driving car is only driving in the same place over-and-over, the odds are that it isn’t learning new things about driving that might well be encountered in other locations. This is like a teenage novice driver that gets used to driving in their own neighborhood and then is terrified to drive on open highways or places they’ve never driven on.

One criticism of the U.S. based driverless car efforts has been that the focus on driving in the United States is leading to self-driving cars that are only familiar with U.S. driving aspects, including the legal requirements and the cultural rules-of-the-road elements.

Will the AI systems be scalable to drive in international settings?

Some believe it will be a child’s play and merely the changing of a few parameters in the software, but anyone that has driven in countries around the world knows that it is harder to switch and adjust to foreign driving practices than it might seem on the surface.

For my coverage of international aspects, see the link here: https://aitrends.com/selfdrivingcars/internationalizing-ai-self-driving-cars/

For more about Machine Learning and AI autonomous cars, see my indication here: https://www.aitrends.com/ai-insider/machine-learning-ultra-brittleness-and-object-orientation-poses-the-case-of-ai-self-driving-cars/

It is likely that self-driving cars will need to drive illegally at times, here’s my explanation: https://aitrends.com/selfdrivingcars/illegal-driving-self-driving-cars/

Additional Scaling Elements

An often-quoted estimate provided by Intel suggests that each driverless car will generate at least 4GB of data per day (likely more), based upon all the camera images and video collected, the radar data collected, and so on.

In theory, the data is going to be pushed up to the cloud of the automaker or tech firm that made the AI systems for the self-driving car, a process known as OTA (Over-The-Air) updating.

On a scaling basis, this means a ton of electronic communications across networks, along with a ton of storage that will be needed in the cloud. Multiply 4GB by 250 million cars by 365 days of the year, and the volume is daunting.

Self-driving cars are going to be communicating with each other via V2V (vehicle-to-vehicle) electronic communication. This will be handy since a self-driving car that encounters a cow in the roadway can electronically alert any upcoming driverless cars that are nearing that juncture of a highway.

Today, the use of V2V among self-driving cars is sparse or non-existent.

On a scaling basis, what happens once thousands of self-driving cars are zooming along on a freeway and they are all sending out a bombardment of V2V messages to each other?

For more about V2V and the role of omnipresence, see my indication here: https://aitrends.com/ai-insider/omnipresence-ai-self-driving-cars/

For added coverage about OTA, see my explanation here: https://aitrends.com/ai-insider/air-ota-updating-ai-self-driving-cars/

For processing by supercomputers of AI autonomous car data, see my indication here: https://aitrends.com/ai-insider/exascale-supercomputers-and-ai-self-driving-cars/

Conclusion

Automakers and tech firms are focused on making baby steps right now. Their aim is to produce a self-driving car that can safely drive on our roadways.

Worrying about scale is not quite as crucial, especially if you aren’t even sure that you can get a self-driving car to function at an autonomous level.

This is often the stance of inventors that are making something brand new that has never existed before. They are concerned primarily with getting the darned invention itself to work. They assume or hope that scaling will eventually be possible, though it’s not necessarily at top-of-mind and a matter that they figure can be deferred until it, later on, becomes paramount.

You might be familiar with the famous story about Thomas Edison and the invention of the light bulb, though you’ve likely only heard the version that’s a half-truth.

Edison and his crew tested around 6,000 different materials as the filament for a light bulb.

Light bulbs already existed, but they were generally impractical due to the filament being overly costly and so flimsy that it wouldn’t last very long.

After thousands of trials using different kinds of filaments, he finally found one that was the Goldilocks version, strong enough to last sufficiently and inexpensive enough to be real-world practical.

I tell the story because Edison’s efforts weren’t per se about inventing the light bulb and instead dealt with making a light bulb that could be scalable.

For self-driving cars, we are still in the period prior to having a working light bulb, as it were, and once we do have a working one the race will be on to figure out how it can be scaled-up.

Scale will matter since having self-driving cars that can only work in narrow ways in narrow places will not be much of a moneymaker and perhaps be discounted as toy-like efforts rather than something applicable to the real-world.

Scaling up could be the fly in the ointment of self-driving car emergence.

Copyright 2020 Dr. Lance Eliot

This content is originally posted on AI Trends.

[Ed. Note: For reader’s interested in Dr. Eliot’s ongoing business analyses about the advent of self-driving cars, see his online Forbes column: https://forbes.com/sites/lanceeliot/]

Leveraging Workload-Driven Infrastructure and Software Defined Architectures for Data-Driven AI/ML and Analytics Applications

penguin-computing

Scheduled for July 14, 2020, 1 pm to 2:00 pm EDT

REGISTER

Data is being generated in larger volumes and faster rates, causing congestion, I/O bottlenecks, storage outages and cost overruns for Artificial Intelligence (AI) and Machine Learning (ML) workloads. As data-intensive workloads scale, it’s critical to implement data-driven software defined architectures to meet the demands of large data sets. Optimized, accelerated data platforms promise an immediate and tangible solution for delivering discovery and insight from machine-generated data. Optimized data platforms combined with accelerated compute and the right software creates a new storage category. This approach provides a data store that delivers an enterprise ready, unified data platform that performs across your entire environment, from edge devices to your core data center. This type of platform is a requirement for data management in the era of AI.

This session will educate the HPC, AI/ML and Analytics communities on the properties of Optimized Accelerated DataOps and will foster a discussion of its adoption for high-performance workloads like AI, ML and analytics. The discussion will focus on new infrastructure solutions leveraging NVMeOF, software defined architectures to handle large volumes of data generated by mixed workloads and advise attendees on the use cases that would benefit from an Optimized Accelerated DataOPs platform(i.e. Advanced Driver Assist System (ADAS), National Language Processing, Edge to Core, Digital Transformation.)

Speaker:

Kevin Tubbs, Ph.D., Sr Vice President Strategic Solutions, Penguin Computing
Kevin has over fifteen years of High Performance Computing (HPC) experience in various areas ranging from software development and application performance characterization and optimization to hardware and systems level deployment and management. Kevin has ten years of experience in GPGPU and accelerator programming and heterogeneous computing solution architecture design. Kevin also has expertise in computational fluid dynamics, computational science, numerical modeling and engineering simulation focused on HPC, AI, and heterogeneous computing implementations. Prior to joining Penguin Computing, Kevin serviced as an HPC consulting and performance engineer for a variety of organizations including Dell, Inc., High Performance Technologies, Inc., the Naval Research Laboratory (NRL), and the Center for Computation and Technology (CCT) at Louisiana State University (LSU). His clients and customers have included, multiple fortune 500 companies, research universities, and government organizations. Kevin’s current focus is providing end-to-end technology solutions.

REGISTER

Thursday, 4 June 2020

How Can AI Chatbots Help Improve Customer Experience

Chatbots are increasingly being used by businesses for numerous business applications, especially customer service. The main reason behind this is that they can help improve your customer experiences.Want to know how?Here are three ways in which AI chatbots can enhance customer experiences:1. Uninterrupted ServiceOne of the main reasons why people love to interact with chatbots for customer support is that they don’t have to wait to talk to a human agent.In today’s age, consumers have become very demanding and they want instant responses. To meet this demand, businesses might have to hire more people to work in different shifts and provide 24x7 support. And, this can be very expensive.Chatbots, on the other hand, can provide 24x7 uninterrupted service. They don’t fall sick or take leaves as your employees do. They can work round the clock ensuring that your customers get instant support.2. Faster and More Accurate ResolutionsAccording to a study by Usabilla, 54% of people prefer talking to a chatbot because they get faster responses. This clearly shows how important it is for consumers to get a quick answer or resolution to their problems.Chatbots can provide that in a much better way than any human. Moreover, chatbots are not prone ...


Read More on Datafloq

How the Minnesota Twins Scaled Pitch Scenario Analysis to Measure Player Performance – Part 1

Statistical Analysis in the Game of Baseball 

A single pitch in Major League Baseball (MLB) generates tens of megabytes of data, from pitch movement to ball rotation to hitter  behavior to the movement of each individual baseball player in response to a hit. How do you derive actionable insights from all this data over the course of a game and season? Learn how the Baseball Operations Group within the 2019 AL Central Division Champion Minnesota Twins is using Databricks to take reams of sensor data, run thousands or tens of thousands of simulations on each pitch, and then quickly generate actionable insights to analyze and improve player performance, scout the competition, and better evaluate talent. Additionally, learn how they are planning to shorten the analysis cycle even further to get these insights to the coaches in order to optimize in-game strategy based on real-time action.

In part 1, we walk through the challenges the Twins’ front office was facing in running thousands of simulations on their pitch data to improve their player evaluation model. We evaluate the tradeoffs around different methodologies for modeling and inferring pitch outcomes in R, and why we chose to proceed with user defined function with R in Spark.

In part 2, we will take a deeper dive into user defined functions with R in Spark. We will learn how to optimize performance to enable scale by managing the behavior of R inside the UDF as well as the behavior of Spark as it orchestrates execution.

Background

There are several discrete baseball statistics that can be used to evaluate a baseball player’s’ performance such as batting average or runs batted in, but the sabermetric baseball community developed Wins Above Replacement (WAR) to estimate a players’ total contribution to the team’s success in a way to make it easier to compare players. From FanGraphs.com:

You should always use more than one metric at a time when evaluating players, but WAR is all-inclusive and provides a useful reference point for comparing players. WAR offers an estimate to answer the question, “If this player got injured and their team had to replace them with a freely available minor leaguer or a AAAA player from their bench, how much value would the team be losing?” This value is expressed in a wins format, so we could say that Player X is worth +6.3 wins to their team while Player Y is only worth +3.5 wins, which means it is highly likely that Player X has been more valuable than Player Y.

Historically, comparing players’ WAR over the course of hundreds or thousands of pitches was the best way to gauge relative value. The Minnesota Twins had data on over 15 million pitches that included not just final outcome (ball, strike, base hit, etc), but also deeper data like ball speed and rotation, exit velocity, player positioning, fielding independent pitching (FIP), and so on. However, any single pitch can have several variables, like batter-pitcher pairing or weather, that affect the play’s expected run value (e.g., the breeze picks up and what could have been a homerun instead becomes a foul ball). But how do you correct for those variables in order to derive a more accurate prediction of future performance?

Based on the law of large numbers, industries like Financial Services run Monte Carlo simulations on historical data to increase the accuracy of their probabilistic models. Similarly, a 100-fold increase in scenarios (think of each pitch as a scenario) leads to a 10-fold more accurate WAR estimate. To increase the accuracy of their expected run value, the Twins looked for a solution that could generate up to 20,000 simulations on each of the pitches in their database, or up to 300 billion scenarios total (15 million pitches x 20,000 simulations per pitch in max scenario = 300 billion total scenarios). Running this analysis  on-prem with Base R on a single node, they realized it would take almost four years to compute the historical data (~8 seconds to run 20k simulations per pitch x 15 million pitches / 3.15×10⁷ seconds per year). If they were going to eventually use run value/WAR estimates to optimize in-game decisions, where each game could generate over 40,000 scenarios to score, they needed:

  1. A way to quickly spin up massive amounts of compute power for short periods of time and
  2. A living model where they could continuously add new baseball data to improve the accuracy of their forecasts and generate actionable insights in near real time.

The Twins turned to Databricks and Microsoft Azure, given our experience with massive data sets that include both structured and unstructured data. With the near limitless on-demand compute available in the cloud, the Twins no longer had to worry about provisioning hardware for a one-time spike in use around analyzing the historical data. Where previously running 40,000 daily simulations would have taken 44 minutes, with Databricks on Azure they unlocked the capability for real-time scoring as data gets generated.

Scaling Pitch Simulation Outcomes by 100X

Modeling and Inferring Pitch Outcomes in R

To model the outcome of a given pitch, the data science team settled on a training dataset consisting of 15 million rows with pitch location coordinates as well as season and game features like pitcher-batter handedness, inning, and so on.  In order to capture the non-linear properties of pitch outcomes in their models, the team turned to the vast repository of open source packages available in the R ecosystem.

Ultimately an R package was chosen that was particularly useful for its flexibility and interpretability when modeling non-linear distributions.  Data scientists could fit a complex model on historical data and still understand the precise effect each predictor has on the pitch outcome.   Since the models would be used to help evaluate player performance and team composition, interpretability of the model was an important consideration for coaches and the business.

Having modeled various pitch outcomes, the team then used R to simulate the joint probability distribution of x-y coordinates for each pitch in the dataset.  This effectively generated additional records that could be scored with their trained models.  Inferring the expected pitch outcome for each simulated pitch sketches an image of expected player performance.   The greater the number of simulations the sharper that image becomes.

A plan was made to generate 20,000 simulations for each one of the 15 million rows in the historical dataset.  This would yield a final dataset of 300 billion simulated pitches ready for inference with their non-linear models, and provide the organization with the data to evaluate their players more accurately.

The problem with this approach was that by nature R operates in a single threaded, single node execution environment.  Even when leveraging the multi-threading packages available in open source and a CPU heavy VM in the cloud, the team estimated that it would take months for the code to complete, if it completed at all.  The question became one of scale:  How can the simulation and inference logic scale to 300 billion rows and complete the job in a reasonable time frame?  The answer lay in the Databricks Unified Analytics Platform powered by Apache Spark.

Scaling R with Spark 

The first step in scaling this simulation pipeline was to refactor the feature engineering code to work with one of the two packages available in R for Spark – SparkR or sparklyr.  Luckily, they had written their logic using the popular data manipulation package dplyr, which is tightly integrated with sparklyr. This integration enables the use of dplyr functions on the tbl_spark objects created when reading data with sparklyr.  In this instance we only had to convert a few ifelse() statements to dplyr::mutate(case_when(...)), and then their feature engineering code would scale from a single node process to a massively parallel workload with Spark!  In fact, about only 10% of the existing dplyr code needed to be refactored to work with Spark.  We were now able to generate billions of rows for inference in a matter of minutes.

How does this dplyr magic work?  To understand this we need to first understand how the R to Spark interface is structured:

R + Spark infrastructure, where most of the R code gets translated into Scala and then sent to JVM where driver tasks are assigned to each worker node.

Most of the functions in the Spark + R packages are wrappers around native Spark classes – your R code gets translated into Scala, and those commands are sent to the JVM on the driver where tasks are then assigned to each worker.  In a similar vein, dplyr verbs are translated into SQL expressions that are then evaluated by Spark through SparkSQL.  As a result one generally should see the same performance in Spark + R packages that you would expect in Scala.

Distributed Inference with R Packages 

With the feature engineering pipeline running in Spark, our attention turned towards scaling model inference. We considered three distinct approaches:

  • Retrain the non-linear models in Spark
  • Extract the model coefficients from R and score in Spark
  • Embed the R models in a user defined function and parallelize execution with Spark

Let’s briefly examine the feasibility and tradeoffs associated with each of these approaches.

Retrain the Non-linear Models in Spark

The first approach was to see if an implementation of the modeling technique from R existed in Spark’s machine learning library (SparkML).  In general, if your model type is available in SparkML it is best to choose that for performance, stability, and simpler debugging. This can require refactoring code somewhat if you are coming from R or Python, but the scalability gains can easily make it worth it.

Unfortunately the modeling approach chosen by the team is not available in SparkML. There has been some work done in academia, but since it involved introducing modifications to the codebase in Spark we decided to deprioritize this approach in favor of alternatives. The amount of work required to refactor and maintain this code made it prohibitive to use as a first approach.

Extracting Model Coefficients 

If we couldn’t retrain in Spark, perhaps we could use the learned coefficients from R models and apply them to a Spark DataFrame?  The idea here is that inference can be performed by multiplying an input DataFrame of features by a smaller DataFrame of coefficients to arrive at predicted values. Again, the tradeoff would be some refactoring code to orchestrate coefficient extraction from R to Spark in order to gain massive scalability and performance.

For this approach to work with this type of non-linear model, we would need to extract a matrix of linear predictors along with the model coefficients.  Due to the nature of the R package being used, this matrix cannot be generated without passing new data through the R model object itself.  Generating a matrix of linear predictors from 300 billion rows is not feasible in R, and so the second approach was abandoned.

Parallelizing R Execution with User Defined Functions in Spark

Given the lack of native support for this particular non-linear modeling approach in Spark and the futility of generating a 300 billion row matrix in R, we turned to User Defined Functions (UDFs) in SparkR and sparklyr.

In order to understand UDFs, we need to take a step back and reconsider the Spark and R architecture shown above.

Spark + R UDF architecture, where UDFs create an R process on each worker, enabling the user to execute arbitrary R code in parallel across the cluster.

With UDFs, the pattern changes somewhat from before.  UDFs create an R process on each worker, enabling the user to execute arbitrary R code in parallel across the cluster.  These functions can be applied to a partition or group of a Spark DataFrame, and will return the results back as a Spark DataFrame. Another way to think of this is that UDFs provide access to the R console on each worker, with the ability to apply an R function to data there and return the results back to Spark.

To perform inference on billions of rows with a model type not available in SparkML, we loaded the simulation data into a Spark DataFrame and applied an R function to each partition using SparkR::dapply. The high level structure of our function was as follows.


results <- dapply(features,
    # x is a partition of data
    function(x) {
    # load model object
    model <- readRDS(“/dbfs/pitch_outcome_model.rds”)
    # infer pitch outcomes 
    x$predictions <- predict(model, data = x)
    # return result
    x
    },  schema = schema)

Let’s break this function down further.  For each partition of data in the features Spark DataFrame we apply an R function to:

  • Load an R model into memory from the Databricks File System (DBFS)
  • Make predictions in R
  • Return the resulting dataframe back to Spark
  • Specify output schema for the results Spark DataFrame

DBFS is a path mounted on each node in the cluster that points to cloud storage, and is accessible from R.  This makes it easy to load models on the workers themselves instead of broadcasting them as variables across the network with Spark.  Ultimately, this third approach proved fruitful and allowed the team to scale their models trained in R for distributed inference on billions of rows with Spark.

Conclusion

In this post we reviewed a number of different approaches for scaling simulation and player valuation pipelines written in R for the Minnesota Twins MLB team.  We walked through the reasoning for choosing various approaches, the tradeoffs, and the architectural differences between core SparkR/sparklyr functions and user defined functions.

From feature engineering to model training, coefficient extraction, and finally user defined functions it is clear that plenty of options exist to extend the power of the R ecosystem to big data.

In the next post we will take a deeper dive into user defined functions with R in Spark.  We will learn how to optimize performance by managing the behavior of R inside the UDF as well as the behavior of Spark as it orchestrates execution.

--

Try Databricks for free. Get started today.

The post How the Minnesota Twins Scaled Pitch Scenario Analysis to Measure Player Performance – Part 1 appeared first on Databricks.

Do you see negotiation as a dispute? The victory is in how you handle this situation

The art of negotiation is a hit by most people. For some commercial managers, they only import 2 skills in their salespeople: prospecting and negotiating skills. Unfortunately, not all salespeople have an equal talent for negotiating with their customers. But, on the other hand, not everyone knows what “knowing how to negotiate” really means. Take a test: ask your team what negotiation is. Among the answers, you will certainly hear: "how to sell at the highest price", or "how to make the best possible deal". This proves how misleading people are about what negotiation is. Taking advantage, what is the definition of trading for you? For some people, negotiation is a set of painful tactics that try to overcome or achieve the surrender of one of the parties involved in the business transaction, as if one party needs to lose in order for the other to win. That’s why, in some cases, getting help from a professional service such as lawdepot partnership agreement service is needed. This original meaning is fundamental to understand why the purpose of negotiation is to continue to do business, understanding the other party to reach an agreement. So throw away the ...


Read More on Datafloq

View: Ease regulations to make India a drone hub

The market for non-military unmanned aerial systems (UAS) — drones — in India has been marred by restrictive policy, which can stagnate this industry in its infancy.

Genie Labs to make IIT-Delhi's PCR diagnostic assay kit for Covid-19

While standard RT-PCR kits in the market are probe-based, this design does away with probes completely. Instead it detects COVID-19 specific RNA sequence in samples.

4 Essential Skills for Women in Data Science

STEM, or science, technology, engineering, and math, has long been a field dominated by men. Currently only about 28% of jobs in these fields are held by women, while even less C-suite level jobs are filled by females in the field. As science-related jobs, especially data science, continue to be some of the highest-paying available, women should look at this field as one full of opportunity, not one that has closed its doors on the female population. Here are four essential skills for women looking to pursue their education in data science, or make a career leap into the field. ConfidenceWhether it’s right or not is another story, but historically and systematically, women have been pushed away from scientific fields since the dawning of the nation. Though the amount of STEM role models is smaller for women, it does certainly exist, and many schools are making conscious efforts to increase female interest in STEM. If you’re a youngster, get involved in these programs at your school, and if you’re someone looking for a career change, reading up on some of the many women who changed science is a great way to thwart any negative thoughts regarding your career path that ...


Read More on Datafloq

Wednesday, 3 June 2020

Machine Learning Plugin project - community bonding blog post

jenkins gsoc logo small

Hello everyone !

This is one of the Jenkins project in GSoC 2020. We are working this new Machine Learning Plugin for this GSoC 2020. This is my story about the community bonding of GSoC 2020. I am happy to share my journey with you.

Introducing Myself and my Fantastic 4 Mentors

I am Loghi Perinpanayagam from University of Moratuwa. I was selected for GSoC 2020 for Machine Learning Plugin in Jenkins. I am glad to introduce my mentors to this project. I was assigned with four mentors who are really enthusiastic to help me on kicking off this summer of code.

Student

Mentors

  • Bruno P. Kinoshita

  • Ioannis Moutsatsos

  • Marky Jackson

  • Shivay Lamba

  • How was my preparation last year ?

    I learned about this open source program in my second year. But atleast I tried last year on a different organization’s project that was related to Data Visualization Recommendation for Data Science. But the problem was I did not contribute as much as this year and was too late in the application process. As usual Machine learning related projects have a lot of competition compared to other projects. I prepared on learning Data visualization in Machine Learning and existing Models for the recommendation system. Finally I wrote a proposal with the SeqToSeq model without much knowledge on neural networks at that time. And I did not communicate much through the dedicated slack channel. That may be one of the reasons for the failure. But the main reason was my latency for GSoC 2019.

    How did I hurdle GSoC 2020 ?

    Since the time I realized how open source is needed and helpful for the community, I have been passionate about contributing to open source projects. At the instance, I finished my internship in Bangalore, India in 2019, I immediately focused on participating in GSoC. This is my last year (2020) as a student of my BSc Computer Science life, I wanted to get selected this year as a student.

    There was a guidance seminar organized by our department, I got to know that Jenkins had opened their project ideas. That was an extremely impressive beginning of my GSoC 2020 journey. I walked through all the draft and accepted projects in the Jenkins.io page. As I am already interested in Machine Learning and I am familiar with Java, I picked the most impressive idea for me that does not have an initial repo. That means I wanted to use my knowledge to think and research a lot with this project. But I had to contribute and want to know about the infrastructure of Jenkins codebase. Because that makes the selection panel easy to pick up the student for the project. Then I repeatedly searched to contribute to Jenkins. I found issues that were easy for me to work from the git plugin and git client plugin. I started to contribute some test issues on git plugin and git client plugin. After I got a clear knowledge on how a plugin works in Jenkins, I started working on the POC with the hint provided in the project idea page. Actually, that was fun to code.

    Mentors have helped many students during the application process. I was able to do a working POC that had a minimum capability to do the task of the project. Finally mentors opened for proposal submission. I hurried to prepare a draft proposal. After I got reviews from mentors, I started to improve the proposal. At the end of the proposal submission, I was able to deliver a good proposal for this project. As I was curious about this plugin, I dug into more on how to integrate Jupyter notebook with this plugin. I published an medium article as a result of my research during the acceptance waiting period.

    Results released

    The result was going to be announced on 4th May, I believed in my project proposal and POC and I got selected for this GSoC 2020. Whoa ! That was a goosebumping moment in my entire life. The feeling was like Something I achieved. As a result of my hard work, I deserved that. For example, I spent 7 days continuously making the POC work without any collision between maven artifacts.

    Community Bonding

    After the release of results, I was preparing myself for the community bonding. There are lots of interactions happening between me and mentors than before.I had to update my project page and my profile in Jenkins.io. We had our first meeting with lots of excitement and love on 10th of May. Mentors and I introduced ourselves even though we know each other. We discussed the high level view of GSoC and I asked some questions that I had in my mind. As my plugin was a new repository, most of the discussion was related to the repository and its name. I had to find a name for the new plugin. We had regular conversations about the blogpost and presentations at the end.

    In the second meeting, We discussed the process for hosting a new plugin in Jenkins, tracking issues with JIRA, blog posts and high level road map for the project. And I suggested some interesting plugin names but they were not matching to the goal of the project, mentors told me to try other names which perfectly describe the project. I was advised to read all the research guidelines and plugin naming conventions. We discussed how code reviews will be done and source code management through the git. After this meeting, our meeting has shifted to the official Jenkins Zoom account.

    Our third meeting was quite serious about our project planning. I had been preparing my design document for the project with the help of mentors before the meeting day. Hence I got lots of reviews and useful examples for my future work on phase 1. At this point, we decided with the plugin name Machine Learning Plugin which was accepted by all mentors and I created the repo and requested a Jira ticket for the plugin hosting request. We were planning to remind the Jira ticket within the next 3 days. Mentors want me to make sure I updated the Jenkins GSoC page before the community period ends. Lots of discussion carried about the design document that I had been preparing last week before the meeting. Some important points from the meeting notes follows :

    • Define features in the design document

    • Diagrams for the operations

    • How plugin works in distributed environment

    • Code editor library

    • Requirements for the first Plugin release

    • Blog post draft document

    • ToDo works for me for next week

    Therefore, I had to work hard after this meeting, this made me involved in the project more. I have to put my huge effort to make this opportunity golden. Our team has the willingness to complete this project and will definitely help the Data Science community with this plugin. Kudos to my team for the amazing work so far!!!

    This was my entire journey until now. Hope you enjoyed it and hope you learned the mistakes I made last year and corrected in this summer. Thanks for reading, and Stay tuned I will be uploading blog posts for those of you interested.

Product Innovation in a Digital Economy: What’s Next for Manufacturing?

Onshape-140

Scheduled for July 21, 2020, 11am to 12 pm EDT

REGISTER

Traditionally it would take more than a year to bring a new hardware product to market – from prototyping to regulatory approvals to manufacturing. However, during the COVID19 crisis, many companies have been able to pivot and deliver live-saving products, fast – ventilators, respirators, test kits or face shields. In fact, MasksOn.org delivered more than 10,000 masks within weeks.

This crisis has proven that innovators can bring products to market at warp speed, especially when lives are at stake. Remote working has not prevented them from being innovative, designing products and saving lives.

Now that we are entering the next phase of the COVID19 era, what does it mean for companies and product developers?

John McEleney, Corporate VP of Strategy, PTC and founder of Onshape and Jeffrey Hojlo, Program Director, Product Innovation Strategies, IDC, will discuss:

  • Challenges of product design in a hyper-connected world
  • Best practices and lessons learned during the pandemic
  • Trends in product development
  • Future of manufacturing
  • And more

Speakers:

John McEleney, Corporate Vice President of Strategy, PTC
Entrepreneur and industry luminary, John McEleney has spent his career transforming businesses, driving corporate strategy and forecasting what’s next in product development and manufacturing. With more than 30 years of experience in mechanical design and software, McEleney understands the innovation challenges customers face in today’s hyper-connected world, and helps them navigate the digital era. He is now the corporate vice president of strategy at PTC.

In 2012, McEleney launched Onshape — the Software-as-a-Service (SaaS) product development platform. It is the only product development platform that’s architected for the cloud, enables engineers to design products on-demand, and collaborate in real time — without being tethered to a machine or device. Onshape was acquired in 2019 by PTC for $470 million. Previously, McEleney was the CEO of CloudSwitch, a cloud enterprise software company acquired by Verizon, and the CEO of SolidWorks, acquired by Dassault Systèmes for $310 million.

McEleney serves as a director of Stratasys Inc., a publicly held 3D printing company. He holds a Bachelor of Science in mechanical engineering from the University of Rochester, a Master of Science in manufacturing systems engineering from Boston University, and an MBA from Northeastern University.

When he is not planning global strategy or interacting with customers, McEleney enjoys skiing, golf, and adventure travel.

Jeffrey Hojlo, Program Director, Product Innovation Strategies, IDC
As Program Director, Product Innovation, Jeff Hojlo leads IDC research and analysis of the PLM and collaborative innovation market, including topics such as the development of an innovation platform and the intersection of product design, development, and digital manufacturing.  Mr. Hojlo is also responsible for research on business and IT issues related to the engineering oriented value chain (EOVC), which includes automotive, aerospace & defense, industrial machinery, and heavy equipment manufacturers, as well as the technology oriented value chain (TOVC), which includes manufacturers in the electronics and semiconductor markets.

REGISTER

Customer Lifetime Value Part 1: Estimating Customer Lifetimes

NOTEBOOK LINK HERE
 
The biggest challenge every marketer faces is how to best spend money to profitably grow their brand. We want to spend our marketing dollars on activities that attract the best customers, while avoiding spending on unprofitable customers or on activities that erode brand equity.
 
Too often, marketers just look at spending efficiency. What is the least I can spend on advertising and promotions to generate revenue? Focusing solely on ROI metrics can weaken your brand equity and make you more dependent on price promotion as a way to generate sales.
 
Within your existing set of customers are people ranging from brand loyalists to brand transients. Brand loyalists are highly engaged with your brand, are willing to share their experience with others, and are the most likely to purchase again. Brand transients have no loyalty to your brand and shop based on price. Your marketing spend ideally would focus on growing the group of brand loyalists, while minimizing the exposure to brand transients.
 
So how can you identify these brand loyalists and best use your marketing dollars to prolong their relationship with you?
 
Today’s customer has no shortage of options. To stand out, businesses need to speak directly to the needs and wants of the individual on the other side of the monitor, phone, or station, often in a manner that recognizes not only the individual customer but the context that brings them to the exchange. When done properly, personalized engagement can drive higher revenues, marketing efficiency and customer retention1, and as capabilities mature and customer expectations rise, getting personalization right will become ever more important. As McKinsey & Company puts it, personalization will be “the prime driver of marketing success within the next five years2”.
 
But one critical aspect of personalization is understanding that not every customer carries with him or her the same potential for profitability. Not only do different customers derive different value from our products and services but this directly translates into differences in the overall amount of value we might expect in return. If the relationship between us and our customers is to be mutually beneficial, we must carefully align customer acquisition cost (CAC) and retention rates with the total revenue or customer lifetime value (CLV) we might reasonably receive over that relationship’s lifetime.
 
This is the central motivation behind the customer lifetime value calculation. By calculating the amount of revenue we might receive from a given customer over the lifetime of our relationship with them, we might better tailor our investments to maximize the value of our relationship for both parties. We might further seek to understand why some customers value our products and services more than others and orient our messaging to attract more higher potential individuals. We might also use CLV in aggregate to assess the overall effectiveness in our marketing practices in building equity and monitor how innovation and changes in the marketplace affect it over time3.
 
But as powerful as CLV is, it’s important we appreciate it’s derived from two separate and independent estimates4. The first of these is the per-transaction spend (or average order value) we may expect to see from a given customer. The second is the estimated number of transactions we may expect from that customer over a given time horizon. This second estimate is often seen as a means to an end, but as organizations shift their marketing spend from acquiring new customers towards retention5, it becomes incredibly valuable in its own right.

How Customers Signal Their Lifetime Intent

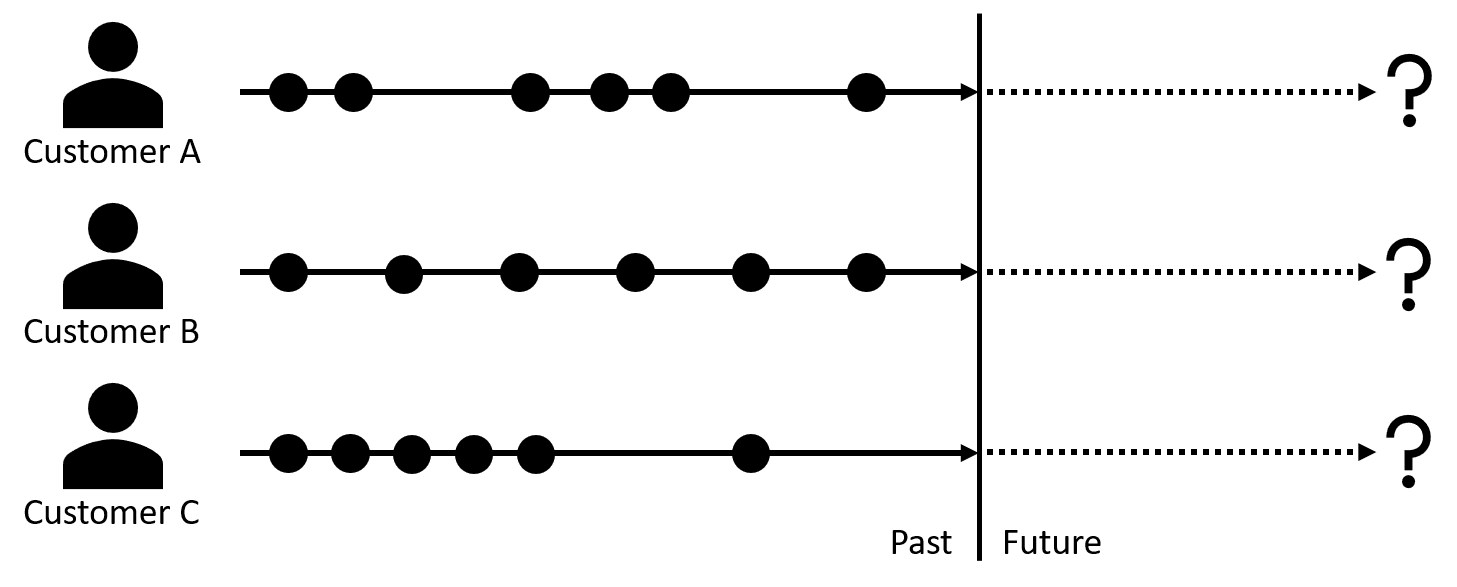
In the non-contractual scenarios within which most retailers engage, customers may come and go as they please. Retailers attempting to assess the remaining lifetime in a customer relationship must carefully examine the transactional signals previously generated by customers in terms of the frequency and recency of their engagement. For example, a frequent purchaser who slows their pattern of purchases or simply fails to reappear for an extended period of time may signal they are approaching the end of their relationship lifetime. Another purchaser who infrequently engages may continue to be in a viable relationship even when absent for a similar duration.

Different customers with the same number of transactions but signaling different lifetime intent

Different customers with the same number of transactions but signaling different lifetime intent

Understanding where a customer is in the lifespan of their relationship with us can be critical to delivering the right messages at the right time. Customers signaling their intent to be in a long-term relationship with our brand, may respond positively to higher-investment offers which deepen and strengthen their relationship with us and which maximize the long-term potential of the relationship even while sacrificing short-term revenues. Customers signaling their intent for a short-term relationship may be pushed away by similar offers or worse may accept those offers with no hope of us ever recovering the investment.
 
Leveraging mlflow, a Machine Learning model management and deployment platform, we can easily map our model to standardized application program interfaces. While mlflow does not natively support the models generated by lifetimes, it is easily extended for this purpose. The end result of this is that we can quickly turn our trained models into functions and applications enabling periodic, real-time and interactive customer scoring of life expectancy metrics.
 
Similarly, we may recognize shifts in relationship signals such as when long-lived customers approach the end of their relationship lifetime and promote alternative products and services which transition them into a new, potentially profitable relationship with ourselves or a partner. Even with our short-lived customers, we might consider how best to deliver products and services which maximize revenues during their time-limited engagement and which may allow them to recommend us to others seeking similar offerings.
 
As Peter Fader and Sarah Toms write in The Customer Centricity Playbook, in an effective customer-centric strategy “opportunities to make maximum financial gains are identified and fully taken advantage of, but these high-risk bets must be weighted out and distributed across lower-risk categories of assets as well.” Finding the right balance and tailoring our interactions starts with a careful estimate of where customers are in their lifetime journey with us.

Estimating Customer Lifetime from Transactional Signals

As previously mentioned, in non-subscription models, we cannot know a customer’s exact lifetime or where he or she resides in it, but we can leverage the transactional signals they generate to estimate the probability the customer is active and likely to return in the future. Popularized as the Buy ‘til You Die (BTYD) models, a customer’s frequency and recency of engagement relative to patterns of the same across a retailer’s customer population can be used to derive survivorship curves which provide us these values.

The probability of re-engagement (P_alive) relative to a customer’s history of purchases

Figure 2. The probability of re-engagement (P_alive) relative to a customer’s history of purchases

The mathematics behind these predictive CLV models is quite complex. The original BTYD model proposed by Schmittlein et al. in the late 1980s (and today known as the Pareto/Negative Binomial Distribution or Pareto/NBD model) didn’t take off in adoption until Fader et al. simplified the calculation logic (producing the Beta-Geometrical/Negative Binomial Distribution or BG/NBD model) in the mid-2000s. Even then, the math of the simplified model gets pretty gnarly pretty fast. Thankfully, the logic behind both of these models is accessible to us through a popular Python library named lifetimes to which we can provide simple summary metrics in order to derive customer-specific lifetime estimates.

Delivering Customer Lifetime Estimates to the Business

While highly accessible, the use of the lifetimes library to calculate customer-specific probabilities in a manner aligned with the needs of a large enterprise can be challenging. First, a large volume of transaction data must be processed in order to generate the per-customer metrics required by the models. Next, curves must be derived from this data, fitting it to expected patterns of value distribution, the process of which is regulated by a parameter which cannot be predetermined and instead must be evaluated iteratively across a large range of potential values. Finally, the lifetimes models, once fitted, must be integrated into the marketing and customer engagement functions of our business for the predictions it generates to have any meaningful impact. It is our intent in this blog and the associated notebook to demonstrate how each of the challenges may be addressed.

Metrics Calculations

The BTYD models depend on three key per-customer metrics:

  • Frequency – the number of time units within a given time period on which a non-initial (repeat) transaction is observed. If calculated at a daily level, this is simply the number of unique dates on which a transaction occurred minus 1 for the initial transaction that indicates the start of a customer relationship.
  • Age – the number of time units from the occurrence of an initial transaction until the end of a given time period. Again, if transactions are observed at a daily level, this is simply the number of days since a customer’s initial transaction to the end of the dataset.
  • Recency – the age of a customer (as previously defined) at the time of their latest non-initial (repeat) transaction.

 
The metrics themselves are pretty straightforward. The challenge is deriving these values for each customer from transaction histories which may record each line item of each transaction occurring over a multi-year period. By leveraging a data processing platform such as Apache Spark which natively distributes this work across the capacity of a multi-server environment, this challenge can be easily addressed and metrics computed in a timely manner. As more transactional data arrives and these metrics must be recomputed across a growing transactional dataset, the elastic nature of Spark allows additional resources to be enlisted to keep processing times within business-defined bounds.

Model Fitting

With per-customer metrics calculated, the lifetimes library can be used to train one of multiple BTYD models which may be applicable in a given retail scenario. (The two most widely applicable are the Pareto/NBD and BG/NBD models but there are others.) While computationally complex, each model is trained with a simple method call, making the process highly accessible.
 
Still, a regularization parameter is employed during the training process of each model to avoid overfitting it to the training data. What value is best for this parameter in a given training exercise is difficult to know in advance so that the common practice is to train and evaluate model fit against a range of potential values until an optimal value can be determined.
 
This process often involves hundreds or even thousands of training/evaluation runs. When performed one at a time, the process of determining an optimal value, which is typically repeated as new transactional data arrives, can become very time consuming.
 
By using a specialized library named hyperopt, we can tap into the infrastructure behind our Apache Spark environment and distribute the model training/evaluation work in a parallelized manner. This allows the parameter tuning exercise to be performed efficiently, returning to us the optimal model type and regularization parameter settings.

Solution Deployment

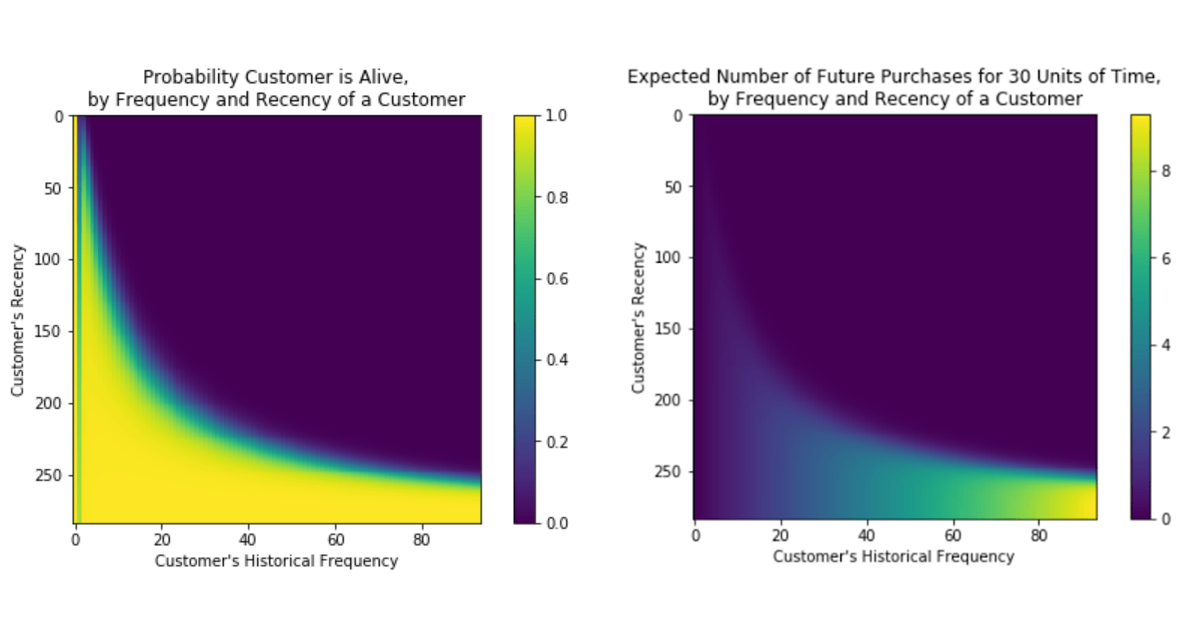
Once properly trained, our model has the capability of not only determining the probability a customer will re-engage but the number of engagements expected over future periods. Matrices illustrating the relationship between recency and frequency metrics and these predicted outcomes provide powerful visual representations of the knowledge encapsulated in the now fitted models. But the real challenge is putting these predictive capabilities into the hands of those that determine customer engagement.

Matrices illustrating the probability a customer is alive (left) and the number of future purchases in a 30-day window given a customer’s frequency and recency metrics (right)

Figure 3. Matrices illustrating the probability a customer is alive (left) and the number of future purchases in a 30-day window given a customer’s frequency and recency metrics (right)

Leveraging mlflow, a Machine Learning model management and deployment platform, we can easily map our model to standardized application program interfaces. While mlflow does not natively support the models generated by lifetimes, it is easily extended for this purpose. The end result of this is that we can quickly turn our trained models into functions and applications enabling periodic, real-time and interactive customer scoring of life expectancy metrics.

Bringing It All Together with Databricks

The predictive capability of the BYTD models combined with the ease of implementation provided by the lifetimes library make widespread adoption of customer lifetime prediction feasible. Still, there are several technical challenges which must be overcome in doing so. But whether it’s scaling the calculation of customer metrics from large volumes of transaction history, performing optimized hyperparameter tuning across a large search space or the deployment of an optimal model as a solution enabling customer scoring, the capabilities needed to overcome each of these challenges is available. Still, integrating these capabilities into a single environment can be challenging and time consuming. Thankfully, Databricks has done this work for us. And by delivering these as a cloud-native platform, retailers and manufacturers needing access to these can develop and deploy solutions in a highly-scalable environment with limited upfront cost.

Download the Notebook to get started.

--

Try Databricks for free. Get started today.

The post Customer Lifetime Value Part 1: Estimating Customer Lifetimes appeared first on Databricks.

DGCA allows Swiggy, Zomato, Dunzo to test-fly long-range drones

India is looking at these experiments as a way of fast tracking its policy and preparing the local industry for a major push into the drone services segment globally

The Top 7 Best Data Science Platforms in 2020

To begin with, a data science platform can be defined as a software hub. All the data science works such as exploring and integrating data utilizing different resources, coding and building models so as to leverage the new-found data, installing those models into the process of production, and serving up results through the reports or applications powered by models. On a precise note, the data science platform works as a storage of diverse tools to accommodate the entire process of data modeling. These platforms not only empower data scientists to craft refined insights from collected data from different resources; but also helps them to communicate the probable results with the clients or stakeholders. Businesses are opting for the data science platforms in order to incorporate smart decision-making process with data analytics and enhance customer satisfaction. With ceaseless advancements of technology, the data science platform is now capable of providing better flexibility and scalability. A smart data science platform helps the data scientists offering the building blocks to create a solution. Also, such platforms create a comfortable environment for incorporating the solutions into products and business processes. Moreover, the best platforms supports the data scientists throughout the process of data ...


Read More on Datafloq

Top Cyber Security Standards That Everyone Must Know and Follow!!

Defining Cyber Security StandardsCybersecurity standards can be defined in the following ways as-A cybersecurity standard is defined as the governing that a business organization needs to follow for gaining the authentic rights for certain things such as- accepting online payments, storing user critical data, etc. These cybersecurity standards comprise of specific basic underlying rules that every business organization needs to follow to maintain and adhere to these defined standards compulsorily. As per the needs of a business or an organization, they can follow a given set of different standards.A cybersecurity standard can also be explained as a detailed list of policies that needs to be applied in a system having compliance for a given standard. Supposedly, if a business organization is looking to accept online payments, then it must compulsorily adhere to the defined PCI-DSS standard. Cyber Security StandardsToday various cybersecurity standards are in effect with the intent of protecting the system and associated users in different ways. Based on what type of data needs to be protected, the following are some important and common cybersecurity standards-1. ISO 27001ISO 27001 depicts one of the most common standards that organizations need to adhere to implementing an ...


Read More on Datafloq

Monday, 1 June 2020

Vectorized R I/O in Upcoming Apache Spark 3.0

R is one of the most popular computer languages in data science, specifically dedicated to statistical analysis with a number of extensions, such as RStudio addins and other R packages, for data processing and machine learning tasks. Moreover, it enables data scientists to easily visualize their data set.

By using SparkR in Apache SparkTM, R codes can easily be scaled. To interactively run jobs, you can easily run the distributed computation by running an R shell.

When SparkR does not require interaction with the R process, the performance is virtually identical to other language APIs such as Scala, Java and Python. However, significant performance degradation happens when SparkR jobs interact with native R functions or data types.

Databricks Runtime introduced vectorization in SparkR to improve the performance of data I/O between Spark and R. We are excited to announce that using the R APIs from Apache Arrow 0.15.1, the vectorization is now available in the upcoming Apache Spark 3.0 with the substantial performance improvements.

This blog post outlines Spark and R interaction inside SparkR, the current native implementation and the vectorized implementation in SparkR with benchmark results.

Spark and R interaction

SparkR supports not only a rich set of ML and SQL-like APIs but also a set of APIs commonly used to directly interact with R code — for example, the seamless conversion of Spark DataFrame from/to R DataFrame, and the execution of R native functions on Spark DataFrame in a distributed manner.

In most cases, the performance is virtually consistent across other language APIs in Spark — for example, when user code relies on Spark UDFs and/or SQL APIs, the execution happens entirely inside the JVM with no performance penalty in I/O. See the cases below which take ~1 second similarly.


// Scala API
// ~1 second
sql("SELECT id FROM range(2000000000)").filter("id > 10").count()

# R API
# ~1 second
count(filter(sql("SELECT * FROM range(2000000000)"), "id > 10"))

However, in cases where it requires to execute the R native function or convert it from/to R native types, the performance is hugely different as below.


// Scala API
val ds = (1L to 100000L).toDS
// ~1 second
ds.mapPartitions(iter => iter.filter(_ < 50000)).count()

# R API
df <- createDataFrame(lapply(seq(100000), function (e) list(value=e)))
# ~15 seconds - 15 times slower
count(dapply(
df, function(x) as.data.frame(x[x$value < 50000,]), schema(df)))

Although this simple case above just filters the values lower than 50,000 for each partition, SparkR is 15x slower.


// Scala API
// ~0.2 seconds
val df = sql("SELECT * FROM range(1000000)").collect()

# R API
# ~8 seconds - 40 times slower
df <- collect(sql("SELECT * FROM range(1000000)"))

The case above is even worse. It simply collects the same data into the driver side, but it is 40x slower in SparkR.

This is because the APIs that require the interaction with R native function or data types and its implementation are not very efficient. There are six APIs that have the notable performance penalty:

  • createDataFrame()
  • collect()
  • dapply()
  • dapplyCollect()
  • gapply()
  • gapplyCollect()

In short, createDataFrame() and collect() require to (de)serialize and convert the data from JVM from/to R driver side. For example, String in Java becomes character in R. For dapply() and gapply(), the conversion between JVM and R executors is required because it needs to (de)serialize both R native function and the data. In case of dapplyCollect() and gapplyCollect(), it requires the overhead at both driver and executors between JVM and R.

Native implementation

Native implementation of R in Spark without vectorization, which requires inefficient (de)serialization and conversion of the data from JVM to R driver side, resulting in a notable performance penalty.

The computation on SparkR DataFrame gets distributed across all the nodes available on the Spark cluster. There’s no communication with the R processes above in driver or executor sides if it does not need to collect data as R data.frame or to execute R native functions. When it requires R data.frame or the execution of R native function, they communicate using sockets between JVM and R driver/executors.

It (de)serializes and transfers data row by row between JVM and R with an inefficient encoding format, which does not take the modern CPU design into account such as CPU pipelining.

Vectorized implementation

In Apache Spark 3.0, a new vectorized implementation is introduced in SparkR by leveraging Apache Arrow to exchange data directly between JVM and R driver/executors with minimal (de)serialization cost.

Implementation of R in Spark with vectorization (available in Spark 3.0), where the data is exchanged between JVM and R executors/drivers with efficient (de)serialization by Apache Arrow, for greater performance.

Instead of (de)serializing the data row by row using an inefficient format between JVM and R, the new implementation leverages Apache Arrow to allow pipelining and Single Instruction Multiple Data (SIMD) with an efficient columnar format.

The new vectorized SparkR APIs are not enabled by default but can be enabled by setting spark.sql.execution.arrow.sparkr.enabled to true in the upcoming Apache Spark 3.0. Note that vectorized dapplyCollect() and gapplyCollect() are not implemented yet. It is encouraged for users to use dapply() and gapply() instead.

Benchmark results

The benchmarks were performed with a simple data set of 500,000 records by executing the same code and comparing the total elapsed times when the vectorization is enabled and disabled. Our code, dataset and notebooks are available here on GitHub.

Performance comparison between SparkR with and without vectorization demonstrates the superior performance of the former against the latter.

In case of collect() and createDataFrame() with R DataFrame, it became approximately 17x and 42x faster when the vectorization was enabled. For dapply() and gapply(), it was 43x and 33x faster than when the vectorization is disabled, respectively.

There was a performance improvement of up to 17x–43x when the optimization was enabled by {spark.sql.execution.arrow.sparkr.enabled }} to true. The larger the data was, the higher performance expected. For details, see the benchmark performed previously for Databricks Runtime.

Conclusion

The upcoming Apache Spark 3.0, supports the vectorized APIs, dapply(), gapply(), collect() and createDataFrame() with R DataFrame by leveraging Apache Arrow. Enabling vectorization in SparkR improved the performance up to 43x faster, and more boost is expected when the size of data is larger.

As for future work, there is an ongoing issue in Apache Arrow, ARROW-4512. The communication between JVM and R is not fully in a streaming manner currently. It has to (de)serialize in batch because Arrow R API does not support this out of the box. In addition, dapplyCollect() and gapplyCollect() will be supported in Apache Spark 3.x releases. Users can work around via dapply() and collect(), and gapply() and collect() individually in the meantime.

Try out these new capabilities today on Databricks, through our DBR 7.0 Beta, which includes a preview of the upcoming Spark 3.0 release.

--

Try Databricks for free. Get started today.

The post Vectorized R I/O in Upcoming Apache Spark 3.0 appeared first on Databricks.

Blockchain’s Disruptive Potential In An AV-reliant Post-Covid World

As we continue to adapt to the social distancing measures brought about by the coronavirus pandemic, we find ourselves relying on audiovisual (AV) technology more than ever before in an effort to maintain relationships, keep up with learning and work commitments, and in a bid to support the museum and entertainment industries.With the likelihood of Covid-19-induced closures in place for the remainder of the year, museums, concert venues and other places of public interest have turned to AV technologies in a bid to ensure their survival and longevity in a post-Covid world. Visitors can now check out some of the world’s most celebrated exhibits virtually - from the Tate Modern, to the Louvre, to the British Museum of London - and Smartify, the “Shazam for art” app, has even said it would make its museums’ audio tours free for a remainder of the year, offering virtual visitors the chance to admire more than two million artworks from across 120 museums and galleries.Using AV technology people can now also go on virtual adventures - to Mars, Hawaii, inside of the world’s best national parks, even tour the Great Wall of China. Churches are also joining the virtual revolution. Using real-time signal ...


Read More on Datafloq

How Blockchain Is Revolutionizing Crowdfunding

According to experts, there are five key benefits of crowdfunding platforms: efficiency, reach, easier presentation, built-in PR and marketing, and near-immediate validation of concept, which explains why crowdfunding has become an extremely useful alternative to venture capital (VC), and has also allowed non-traditional projects, such as those started by in-need families or hopeful creatives, a new audience to pitch their cause. To date, $34 billion has been raised through crowdfunding initiatives, adding roughly $65 billion to the global economy in line with projections that show a possible $90 billion valuation for all crowdfunding sources, surpassing venture capital funding in the process. [2]


Limitations of Current Crowdfunding Platforms [1]1. High fees: Crowdfunding platforms take a fee for every project listed. Sometimes, this is a flat fee while others require a percentage of the total proceeds raised by contributors. This cut into the availability of funds and strains the fundraising process when start-ups are looking for every single dollar to help.2. Fine print rules and regulations: Not all platforms accept services as a possible project and demand real tangible products, such mindset cripple’s ...


Read More on Datafloq

SpaceX's historic encore: Astronauts arrive at space station

It was the first time a privately built and owned spacecraft carried astronauts to the space station in its more than 20 years of existence